diff options
Diffstat (limited to 'README.md')
| -rw-r--r-- | README.md | 18 |
1 files changed, 12 insertions, 6 deletions
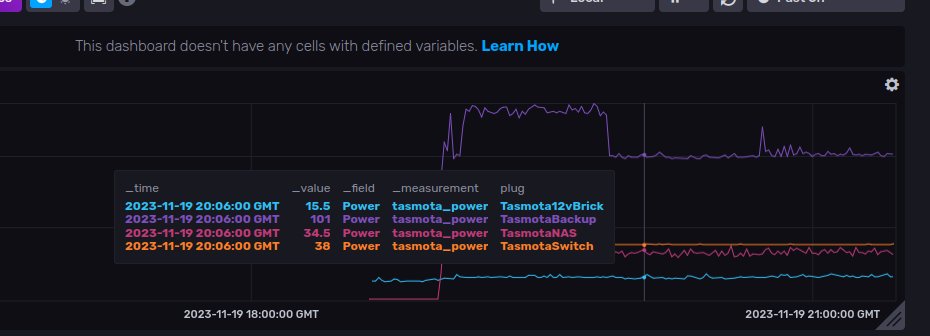
@@ -1,13 +1,11 @@ -# power.eda.gay +# SNMP and MQTT Power Logger & Visualizer -Logs Tasmota-flashed power usage monitors, and TP-Link Omada POE switches, to InfluxDB and Grafana using MQTT and SNMP. +Logs Tasmota-flashed power usage monitors, and TP-Link Omada/Mikrotik POE switches, to InfluxDB and Grafana using MQTT, SNMP and prometheus. Also logs Zigbee informtion with a Tasmota-flashed Zigbee bridge. -Looking for the Mikrotik POE usage monitor/exporter? That's been moved to [MikrotikPOEPowerExporter](https://github.com/jwansek/MikrotikPOEPowerExporter) +Looking for the Mikrotik POE usage monitor/exporter? That's in [`mikrotik.py`](/switch-snmp/mikrotik.py) - - - + ## Setup @@ -29,3 +27,11 @@ Looking for the Mikrotik POE usage monitor/exporter? That's been moved to [Mikro You must enable SNMP in the Omada controller with the community string `tplink`:  + +Moreover mikrotik switches must be set up with an appropriate SSH key pair so they can be polled through SSH + +## MQTT setup + +We are using a [Tasmota-flashed zigbee coordinator](https://www.aliexpress.com/item/1005005254486268.html) to transmit zigbee messages to our MQTT castor, and [Tasmota-flashed plugs](https://www.aliexpress.com/item/1005008427641332.htm) for logging power from the wall over MQTT. Both must be configured with an appropriate friendlyname and told access the MQTT castor. + +  |
